Tracking usage data
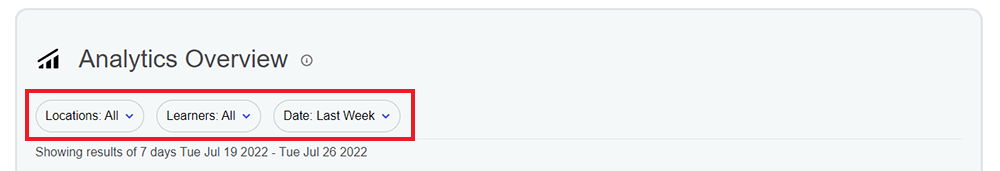
In the Analytics section of the Strivr Portal, you can view usage data for learners and for each course, module, and Immersive Learning experience. On the Analytics Overview page, you’ll see usage data over a given time period. Use the filters at the top of the page to select the locations and learners for which you want to see usage data. Then set a time period from the Date drop-down.
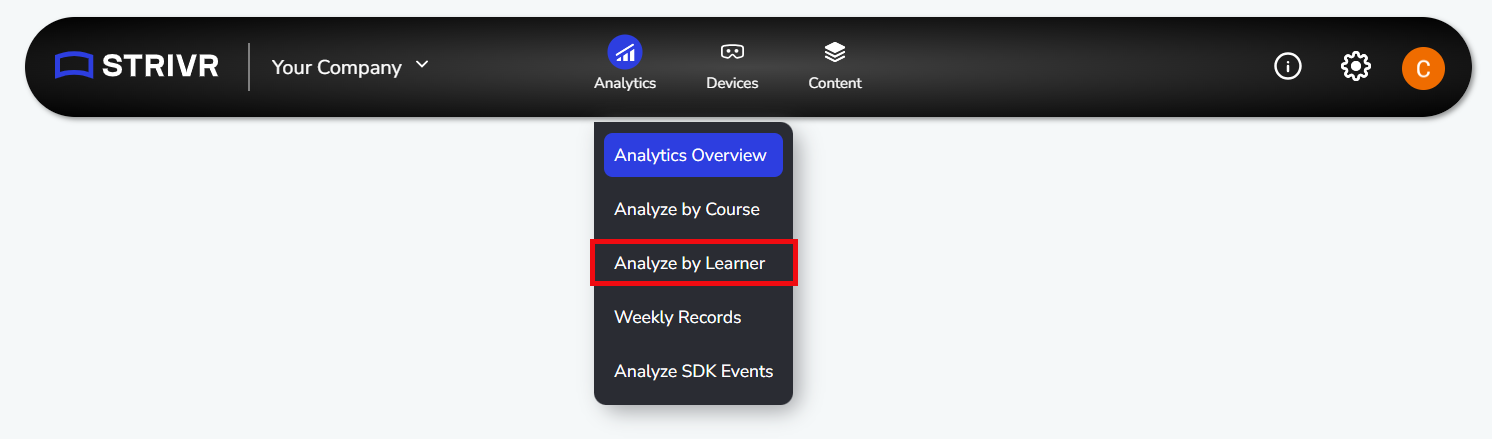
To see a list of learner IDs and their usage data, Click Explore by learner in the Unique Learners over Time graph, or select Analyze by Learner from the Analytics menu at the top of the page.
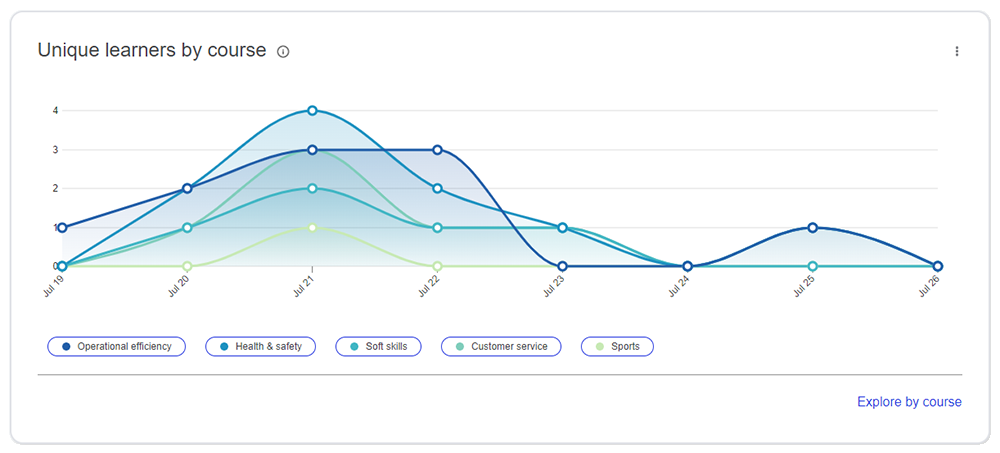
The Unique learners by course graph shows each course in your company’s Content Library, with total learners over time. To hide a course from the graph, click its name below the graph. To view usage data for each course, module, and experience, click Explore by course under the graph, or select Analyze by Course from the Analytics menu at the top of the page.
At the bottom of the Analytics Overview page, you’ll see a graph showing total unique learners by location. To show specific locations, type a location name (or part of one) into the search bar within the graph. You can also toggle between a bar graph and bubble graph using the View as drop-down under the graph.