Tracking performance data
In the Analytics section of the Strivr Portal, you can view learner performance data for any course and the modules within that course. Performance data includes score information by experience, by concept, and by question.
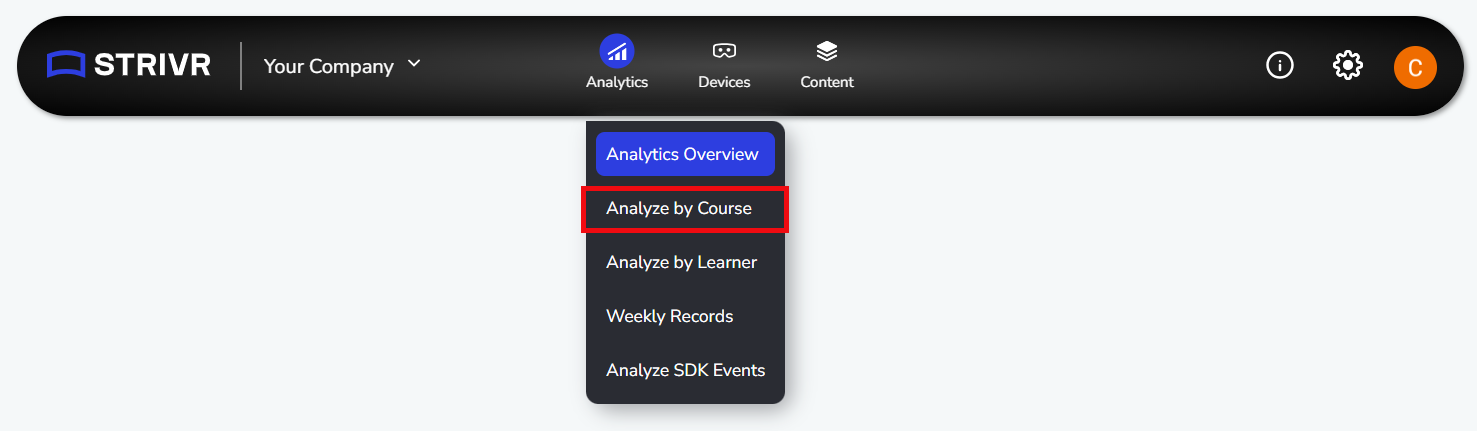
Get started by selecting Analyze by Course from the Analytics menu at the top of the page.
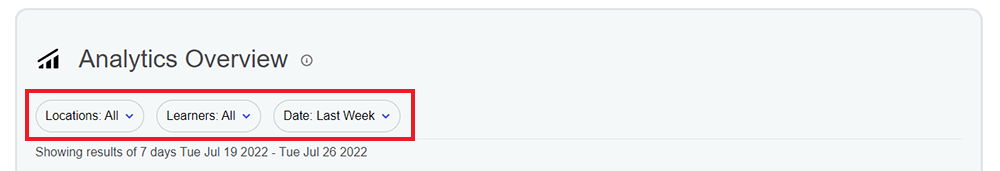
Use the filters to select the locations and learners for which you want to see performance data. Then set a time period from the Date drop-down.
Finally, select a course and a module within that course. The data on the page refreshes with each choice you make.
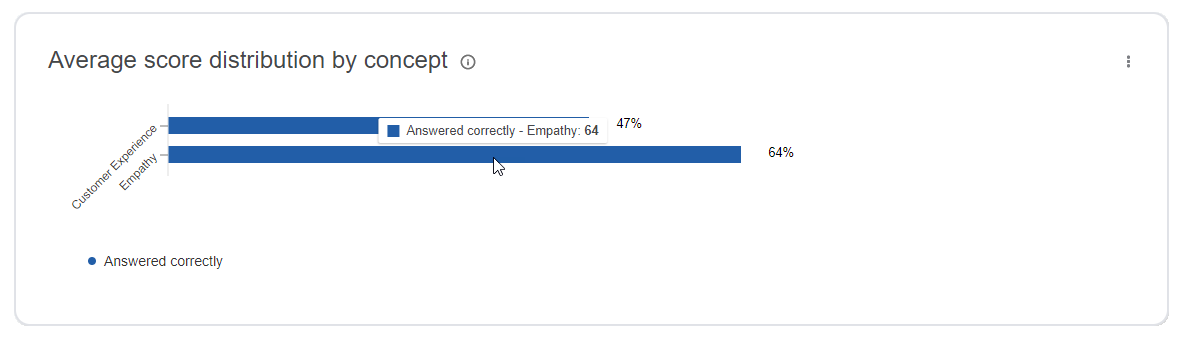
The first graphs you’ll see on the Analyze by Course page show usage data for the selected course. Scroll down the page to see a graph displaying average score distribution by concept. This graph shows the average score for all answers tagged to each learning concept.
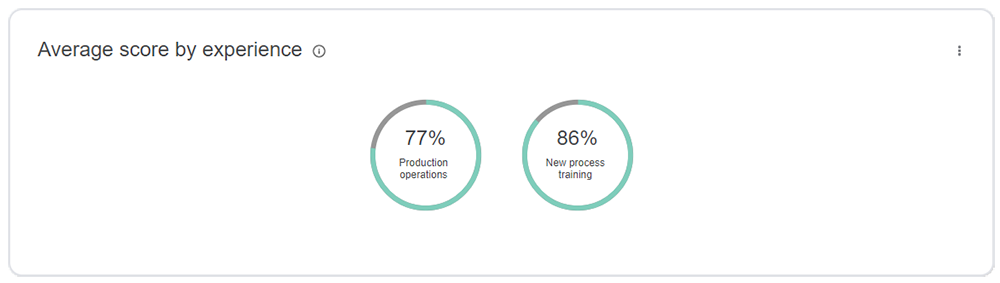
Further down the page, you’ll see data for each experience within each selected course and module: Average score by experience presents the overall average score for users, both as a circle graph and a percentage.
You’ll also see score distribution by experience, showing how many users scored within each score range and, next to that, a graph showing how many questions fell within each score range.
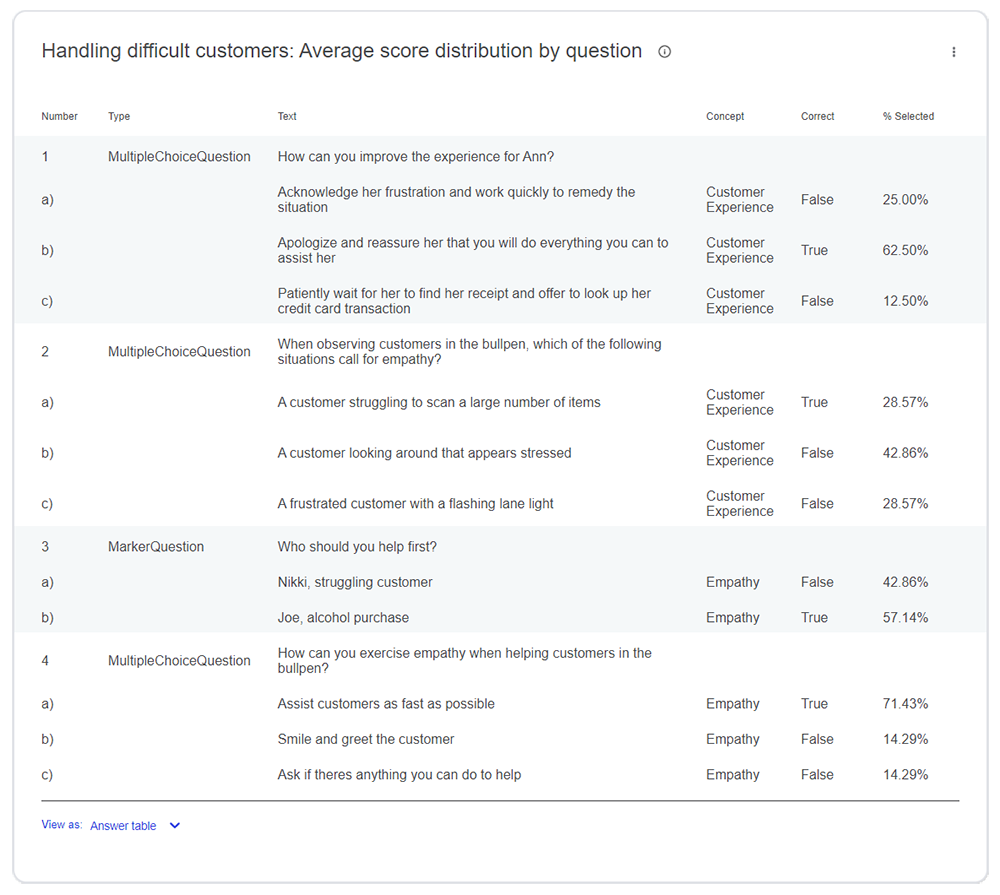
At the bottom of the page, for each experience in the module, you’ll see a graph that shows the average score for all learners on each question in the experience. The correct answer is shown in a cross-hatched bar.
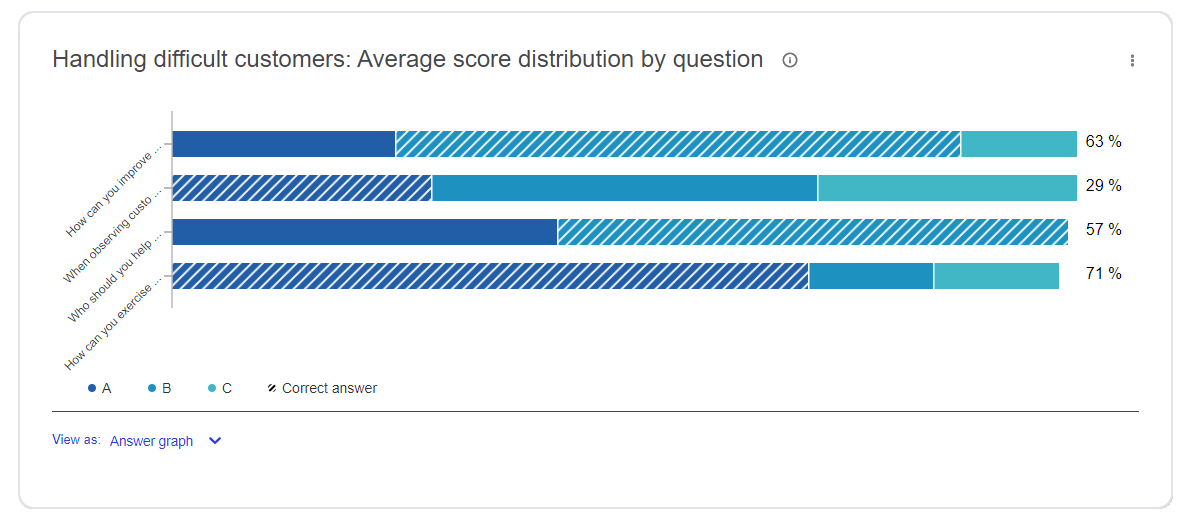
Use the View as selector under the graph to switch to a tabular view of this data. In the tabular view, correct answers are marked True in the Correct column.