Analytics
In the Analytics section of the Strivr Portal, you can review results and key indicators from your company’s Immersive Learning experiences. The Overview page shows high-level trends over a selected date range. Switch to Analyze by Course to see performance and usage data for a specific course, or Analyze by Learner to see usage for each employee login ID.
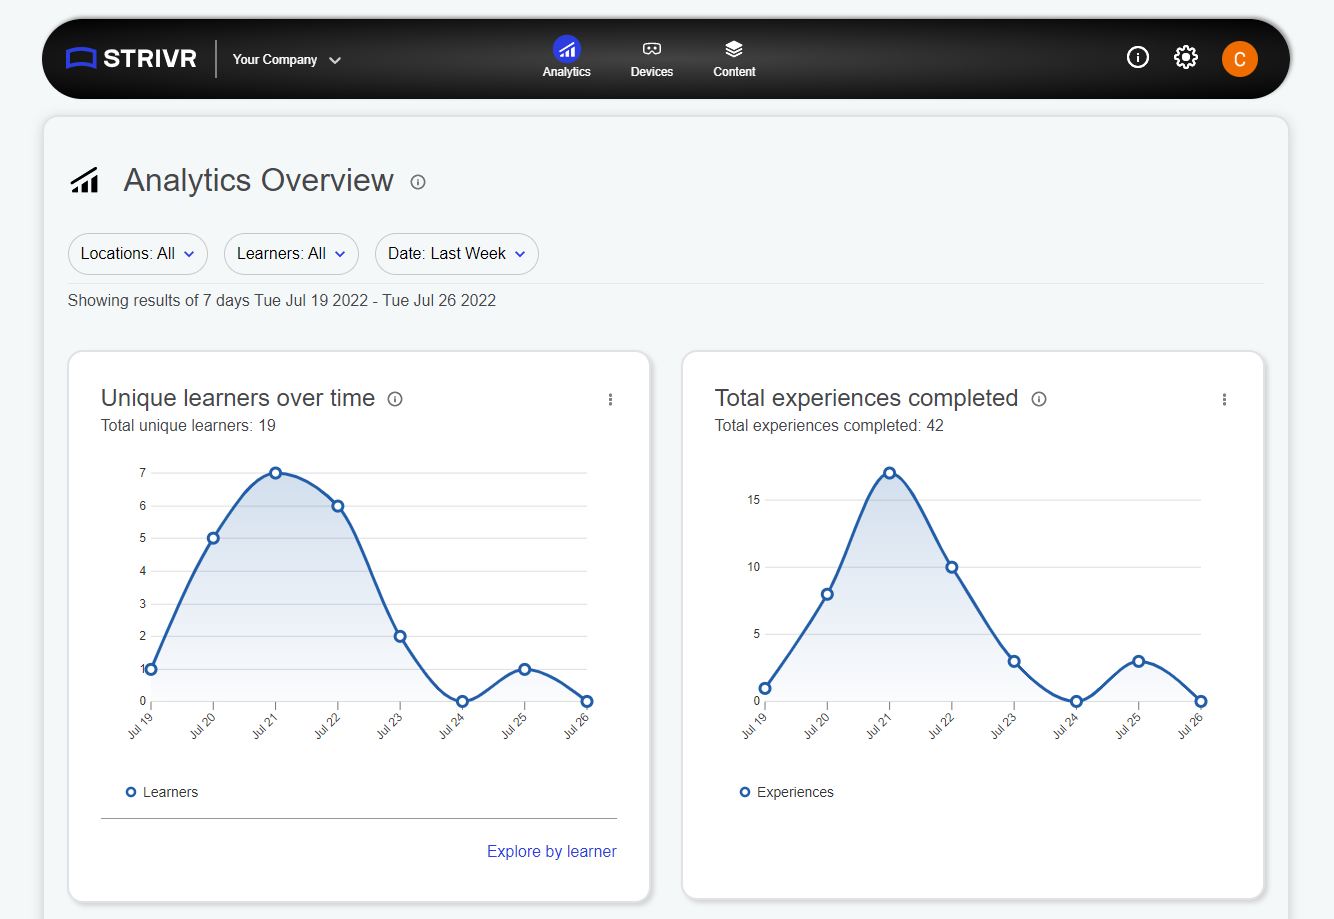
In each page of the Analytics section, you’ll see drop-down menus at the top of the page that allow you to filter your dataset.
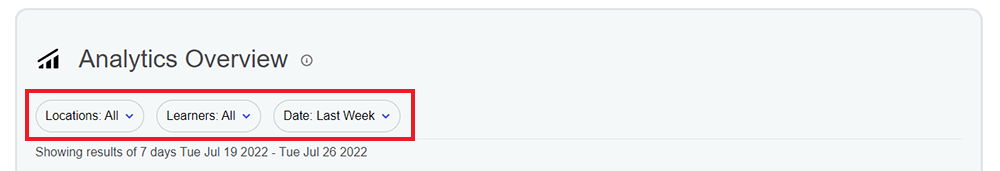
These drop-downs allow you to filter analytics data based on location, learners, and date. Then you’ll see Key Performance Indicators that show a summary of important metrics, like Unique Learners, Average Activity Duration, and Completed Activities. Scrolling down the page, you’ll see graphs and charts breaking down the data.
Data in the Analytics section of the Portal is updated every hour.
NOTE: To add Business Information (BI) tags that further refine your data categories (for example, add the tags Manager and Region to refine Location filtering), contact your Strivr CSM.